shinyでデバッグプリントを出す方法

すぐ忘れるのでメモ

shinyとは

Rの軽量Webフレームワークshiny。Rで計算した結果をWebで簡単に表現できるので非常に便利です。

RStudioを使ってデバッグすればいいのでしょうが、サーバサイドでいきなりコーディングし、訳の分からないエラーが発生した時には非常に困ります。
簡単にデバッグする方法は以下のとおりです

ブラウザ

Chromeのメニューから「その他のツール」ー「デベロッパーツール」を選択します。
そのメニューからConsoleを表示させると、Javascriptでサーバ側のエラーを表示してくれます。
これは非常に便利。

デバッグプリント

ソースコード上にデバッグプリントを埋め込んで変数の内容を確認するには

cat(file=stderr(),"debug=",value)

こんな感じでserver.R上に記述します。これで /var/log/shiny-server以下のファイルに出力されます。

まとめ

Rはスクリプト言語なので、エラーになる直前までは普通に実行してくれますので、エラーとなる直前にデバッグプリントを仕込むと良いでしょう

激安$3以下のebayで買ったArduino nanoを動かす

激安ArduinoNanoをなんとか動かしたメモ

ebayで最近よく物を買っています。Arudinoなんかですと国内で買う価格の半額どころか10分の1くらいの値段で手に入ります。

しかし、互換チップなどを使っているのでドライバーを入れたり色々面倒なことが起きたりします。

今回、購入したこちらのArudino uno ですが一筋縄ではいきませんでしたのでその対応のメモです。

環境

PC: Mac OS X 10.11
IDE: Arduino IDE 1.6.11

ch340gドライバ

こちらのUSBドライバは格安の互換品らしく、ドライバーを別途入れてやらないとPCからは認識できません。この辺りの手順は色々なところに書かれていますので、このあたりを参考にドライバー追加します。

IDE

ドライバを追加し、Arduino Nano をPCに接続してやります。自分の場合はMACなのでポートはArduinoIDEからは

/dev/cu.wchusbserial1420

というデバイスで認識されますので、ポートをこちらに接続してやります。

Blinkプログラムの書き込み

USBを接続し、ファイルメニューからスケッチの例ー01.BasicーBlinkを開いてやります。
ツールのボードをArduino Nano にし、プロセッサをATmega328、ポートは先ほどのポートをセットします。
そのまま、マイコンボードに書き込むを実行すると

avrdude: stk500_recv(): programmer is not responding
avrdude: stk500_getsync() attempt 1 of 10: not in sync: resp=0x00

このエラー。。。。。色々調べたのですが、ケーブルを入れさししろとか、リセットを押しながらケーブルを入れるとか。。。全く改善されません。

よーく見るとRXやLのLEDが電源をONにしても光っていないことに気づきました。

ブートローダを書き込む

どうやらブートローダが書き込まれていないのではという目星をつけて色々調べたところ、こちらにまさに解決方法が!

手順は以下に示しておきます

必要なもの

Arduino UNO
オスーメスのジャンパーピン

手順

STEP 1

  • Arduino UNOをPCに接続
  • ツールメニューのシリアルポートをArduino UNOのポートに
  • ツールメニューのボードをArduino UNOに
  • ファイルメニューのスケッチの例からArduino ISPを開く
  • マイコンボードに書き込むを実行
  • USBケーブルをはずしてPCからはずす

STEP 2

  • Arduino Nanoのジャンパーピン1からUNOのD12へ接続
  • Arduino Nanoのジャンパーピン2からUNOの5Vへ接続
  • Arduino Nanoのジャンパーピン3からUNOのD13へ接続
  • Arduino Nanoのジャンパーピン4からUNOのD11へ接続
  • Arduino Nanoのジャンパーピン5からUNOのD10へ接続
  • Arduino Nanoのジャンパーピン6からUNOのGNDへ接続

STEP 3

  • Arduino UNOをPCに接続
  • ツールメニューのシリアルポートをArduino UNOのポートに
  • ツールメニューのボードをArduino Nanoに
  • ツールメニューのプロセッサをATmega328に
  • ツールメニューの書き込み装置をArduino as ISPへ
  • ツールメニューのブートローダ書き込みを実行

これでブートローダが書き込まれて無事Arduino Nano のLのLEDが光ります。

STEP 4


ケーブルを全て外してArduino Nanoの動作確認をします

  • Arduino NanoをPCに接続
  • ツールメニューのシリアルポートをArduino Nanoのポートに
  • ツールメニューのボードをArduino Nanoに
  • ツールメニューのプロセッサをATmega328に
  • ツールメニューの書き込み装置をAVRISP mkIIに戻しておく(不要かも)
  • ファイルメニューからスケッチの例ー01.BasicーBlinkを開く
  • マイコンボードに書き込むを実行

これで無事にLチカができました

bottleでMVC

pythonでデータ解析をしていると、その結果をヴィジュアル的に見せたくなってくる時があります。
PythonのWebフレームワークは様々ありますが、最もシンプルなbottleで作成するのが一番簡単です。

こちらのサイトで、BottleをMVCフレームワーク的に作成されているサンプルがありましたのでちょっといじってみました。その際、ちょっとハマったのでのメモです。

環境

  • OS: ubuntu14.04
  • python: 2.7.6
  • MySQL version: 5.1.63
  • MySQL encode: shift_jis
  • nginx 1.4.6

設定

nginx

http://server/pythonでアクセスできるようにnginxの設定ファイルを修正します

/etc/nginx/site-availables

server {
..

        location /python {
                rewrite ^/python/(.*)$ /$1 break;
                proxy_pass http://localhost:8081;
                proxy_redirect http://localhost:8081/ $scheme://$host/python/;
                proxy_http_version 1.1;
                proxy_set_header Upgrade $http_upgrade;
                proxy_set_header Connection $connection_upgrade;
                proxy_read_timeout 20d;
        }
..

スクリプト

起動スクリプトを作成します

start.sh

gunicorn -b 127.0.0.1:8081 -c gunicorn.conf.py -w 1 index:app -D --reload  

gunicorn.conf.py

proc_name = "gunicorn"

bind = 'unix:/tmp/{0}.sock'.format(proc_name)
backlog = 2048


workers = 1
worker_class = 'sync'
worker_connections = 1000
timeout = 30
keepalive = 2


debug = False
spew = False

daemon = True
pidfile = "/tmp/gunicorn.pid"
umask = 0
user = None
group = None
tmp_upload_dir = None

errorlog = '/var/log/gunicorn/error.log'
loglevel = 'debug'
accesslog = '/var/log/gunicorn/access.log'


def post_fork(server, worker):
    server.log.info("Worker spawned (pid: %s)", worker.pid)

def pre_fork(server, worker):
    pass

def pre_exec(server):
    server.log.info("Forked child, re-executing.")

def when_ready(server):
    server.log.info("Server is ready. Spawning workers")

def worker_int(worker):
    worker.log.info("worker received INT or QUIT signal")

    ## get traceback info
    import threading, sys, traceback
    id2name = dict([(th.ident, th.name) for th in threading.enumerate()])
    code = []
    for threadId, stack in sys._current_frames().items():
        code.append("\n# Thread: %s(%d)" % (id2name.get(threadId,""),
            threadId))
        for filename, lineno, name, line in traceback.extract_stack(stack):
            code.append('File: "%s", line %d, in %s' % (filename,
                lineno, name))
            if line:
                code.append("  %s" % (line.strip()))
    worker.log.debug("\n".join(code))

def worker_abort(worker):
    worker.log.info("worker received SIGABRT signal")

文字化け

上記環境で参考サイトを元に作成すると、DBの文字列を表示する際に文字化けしてしまいます。この対処法は散々悩んだ挙句この修正で行けました

app/models/db.py

dbhandle = MySQLdb.connect(
  host = config.get('live_db', 'host'),
  port = config.getint("live_db","port"), 
  user = config.get('live_db', 'user'),
  passwd = config.get('live_db', 'password'),
  db = config.get('live_db', 'database'),
  charset = "sjis",  # これを追加
  use_unicode=1
)

ESP-WROOM-02とArduino unoでWifi

Arduino UnoとWifiモジュールのESP-WROOM-02 DIP化キットをつないで通信をしてみます。

ESP-WROOM-02自体でもArduinoとしてプログラムを書き込んで使用できるようですが、ESP-WROOM-02に繋ぐためのUSBシリアル変換インターフェースを持っていないのでとりあえずArduinoと接続して使えるかどうか確認します。

使用する機器

回路

ArduinoとESP-WROOM-02を繋ぐ回路が必要なのですが、このDIP化キットとArduinoUnoをつないだ回路をWebで発見することが出来ず苦労しました。
このあたりこのあたり、あとこのページを参考にさせていただいて作成したのがこれ。

DSC_0250

プログラム

参考にしたサイトからこれを作成しました。

//https://ics.media/entry/10457/3
//http://okiraku-camera.tokyo/blog/?p=2873
/*
  Software serial multple serial test

 Receives from the hardware serial, sends to software serial.
 Receives from software serial, sends to hardware serial.
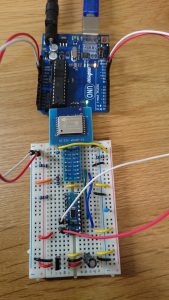
 The circuit:
 * RX is digital pin 10 (connect to TX of other device)
 * TX is digital pin 11 (connect to RX of other device)

 Note:
 Not all pins on the Mega and Mega 2560 support change interrupts,
 so only the following can be used for RX:
 10, 11, 12, 13, 50, 51, 52, 53, 62, 63, 64, 65, 66, 67, 68, 69

 Not all pins on the Leonardo and Micro support change interrupts,
 so only the following can be used for RX:
 8, 9, 10, 11, 14 (MISO), 15 (SCK), 16 (MOSI).

 created back in the mists of time
 modified 25 May 2012
 by Tom Igoe
 based on Mikal Hart's example

 This example code is in the public domain.

 */
#include 

SoftwareSerial mySerial(11, 10); // RX, TX

void setup() {
  // Open serial communications and wait for port to open:
  Serial.begin(115200);
  while (!Serial) {
    ; // wait for serial port to connect. Needed for native USB port only
  }


  Serial.println("Goodnight moon!");

  // set the data rate for the SoftwareSerial port
  mySerial.begin(115200);
  mySerial.println("Hello, world?");
}

void loop() { // run over and over
  if (mySerial.available()) {
    //Serial.println("mySerial avairable");
    Serial.write(mySerial.read());
  }
  if (Serial.available()) {
    //Serial.println("Serial avairable");
    mySerial.write(Serial.read());
  }
}

実行

Arduino IDEからツール、シリアルモニタを開いて確認します

Goodnight moon!
Hello, world?

ERROR
HELO  # <- 入力

ERROR
AT     # <- 入力


OK
HELO   # <- 入力

ERROS

入力した文字がそのままエコーされています

まとめ

プログラムを実行しても Hello, Worldが返ってこなかったりし、いろいろ回路をいじったりしましたが、なぜこれで動くのかちょっとわかりませんが動くのでこれでよしとします。次は実際にWifi通信してみることにします

pythonのmatplotlibでcandlestickチャート

MySQLからデータを取得し、Pythonのmatplotlibでローソク足を描画します。

環境

  • OS:MacOS10.11
  • python:2.7.12
  • MySQL 5.6

テーブル

MySQLのテーブル形式は以下のとおり。日足でも週足でもなんでも構いません。
データベース名はdbnameとしています

create table price_table(
  date datetime not null,
  code varchar(8) not null,
  open double precision null,
  high double precision null,
  low  double precision null,
  close double precision null,
  volume double precision null
)
;
create unique index idx_price on price(date,code)
;

休日考慮

シンプルにローソク足だけ表示します
休日がある場合には間を空けます

#!/bin/env python
# coding:utf-8

import matplotlib.pyplot as plt
from matplotlib.finance import candlestick_ohlc
import time
import MySQLdb

connection = MySQLdb.connect(host="localhost",db="dbname",user="root",passwd="")
cursor = connection.cursor()

code = "6758"
date='2016-04-01'
cursor.execute("select date,open,high,low,close,volume from price_table where code=%s and date>=%s",[code,date])
result = cursor.fetchall()

ohlc=[]
fdate=[]  # float
ddate=[]  # datetime
for row in result:
  tmp=time.mktime(row[0].timetuple())
  ohlc.append((tmp,row[1],row[2],row[3],row[4],row[5]))  # unix time
  ddate.append(row[0])
  fdate.append(tmp)
cursor.close()
connection.close()


# graph上のfloat型の日付と、表示文字列を紐付けている
plt.xticks(
	fdate[::5],
	[x.strftime('%Y-%m-%d') for x in ddate][::5]
)


ax = plt.subplot()

candlestick_ohlc(ax,ohlc)

plt.xlabel('Date')
plt.ylabel('Price')
plt.title("title")
plt.legend()
plt.show()

休日考慮しない

シンプルにローソク足だけ表示します
休日を無視して詰めて描画します。テクニカルを重ね合わせる場合はこちらのほうが都合がいいです

#!/bin/env python
# coding:utf-8

import matplotlib.pyplot as plt
from matplotlib.finance import candlestick_ohlc
import time
import MySQLdb

connection = MySQLdb.connect(host="localhost",db="dbname",user="root",passwd="")
cursor = connection.cursor()

code = "6758"
date='2016-04-01'
cursor.execute("select date,open,high,low,close,volume from price_table where code=%s and date>=%s",[code,date])
result = cursor.fetchall()

ohlc=[]
fdate=[]  # float
ddate=[]  # datetime
adr=1
for row in result:
  tmp=adr
  ohlc.append((adr,row[1],row[2],row[3],row[4],row[5]))
  ddate.append(row[0])
  fdate.append(adr)
  adr=adr+1
cursor.close()
connection.close()


# graph上のfloat型の日付と、表示文字列を紐付けている
plt.xticks(
	fdate[::5],
	[x.strftime('%Y-%m-%d') for x in ddate][::5]
)


ax = plt.subplot()

candlestick_ohlc(ax,ohlc)

plt.xlabel('Date')
plt.ylabel('Price')
plt.title("title")
plt.legend()
plt.show()

これでとりあえずチャートが表示されます